

Prometheus
VerifiedOpen source monitoring and time series database that became the cloud native standard
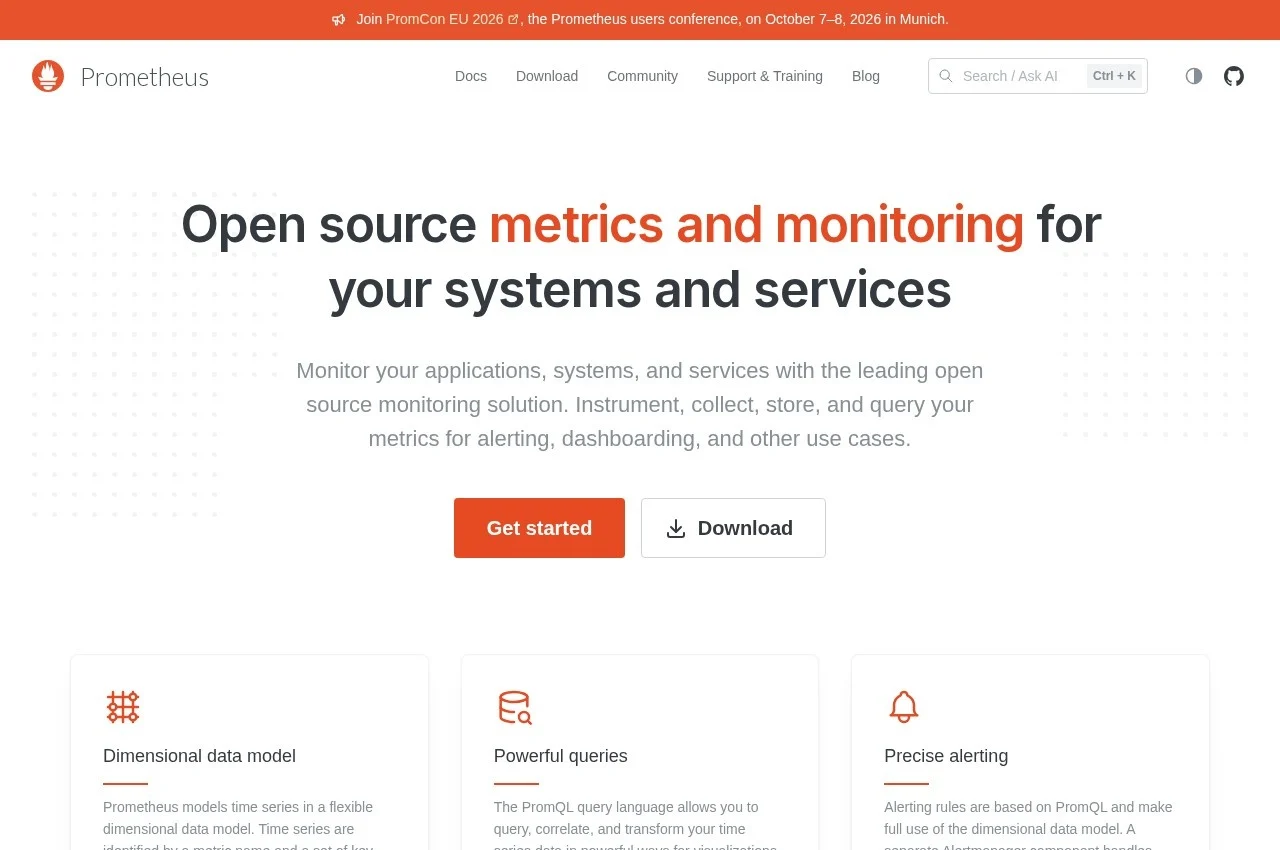 See all screenshots
 - Deployment On Premise, Cloud Based, Hybrid
- Starting price Free and open source
- Free trial Available
- Best for Small Business, Medium Business, Large Enterprise
What is Prometheus?
Prometheus is a monitoring system and time series database that has become the effective standard for cloud native infrastructure. It is 100 percent open source and community driven, with all components available under the Apache 2 License on GitHub, which means there is no licence cost and no vendor able to change the terms.
Its intellectual lineage is Google's internal Borgmon system. As the Site Reliability Engineering book notes, Borgmon remains internal to Google, but the idea of treating time series data as a data source for generating alerts is now accessible to everyone through open source tools like Prometheus. That idea, alerting computed from queries over time series rather than fixed thresholds on individual checks, is what separates it from earlier monitoring tools.
It was designed for the cloud native world and integrates with Kubernetes and other cloud and container managers to continuously discover and monitor services. That continuous discovery is essential in environments where workloads are created and destroyed constantly and a static list of monitoring targets would be obsolete within minutes.
Prometheus was the second project to graduate from the Cloud Native Computing Foundation, after Kubernetes itself, which is a significant marker of maturity and governance. Hundreds of official and community contributed integrations make it straightforward to extract metrics from existing systems, so adoption rarely requires instrumenting everything from scratch.
Key Features of Prometheus
- Time series database
- Query based alerting
- Kubernetes service discovery
- Cloud and container manager integration
- Hundreds of official and community integrations
- Metric extraction from existing systems
- Apache 2 licensed open source
- CNCF graduated project
- Community driven development
- Exporter ecosystem
Prometheus Pricing
Open source
Free and open source
All components are available under the Apache 2 License on GitHub. Costs are infrastructure and engineering time rather than licensing.
Prometheus Specifications
- Deployment
- On Premise
- Cloud Based
- Hybrid
- Desktop
- Linux
- Windows
- Mac
- Web App
- Built for
- Small Business
- Medium Business
- Large Enterprise
- Support
- Knowledge Base
- Public API
- Yes
- Free trial
- Yes
- Free plan
- No
- Runs in browser
- No
- Customisable
- No
- Website
- prometheus.io
Prometheus Screenshots
Prometheus Comparisons


Used Prometheus? Write the first review.
Prometheus FAQs
Alternatives to Prometheus
Other Container Monitoring Tools recorded on the same fields.