
Every guide to this software is published by a company that sells one.
That’s not a complaint about their honesty. It’s a description of what’s missing.
Nobody selling a visibility score has a reason to explain how that score gets produced. The production method is the part that decides whether you should pay for it.
These tools cannot see what people ask AI assistants. No vendor has the query logs. Every score you’ll be shown is measured against a list of questions the vendor wrote.
Key Takeaways
- Scores come from prompts the vendor invented, not from real assistant traffic.
- Prompt sets differ between vendors, which is why two tools disagree about you.
- Repeat runs of one prompt return different answers, so small weekly moves are noise.
- Manual checks cost nothing and settle whether paid tracking earns its price.
What These Tools Measure
One mechanism sits underneath all of them.
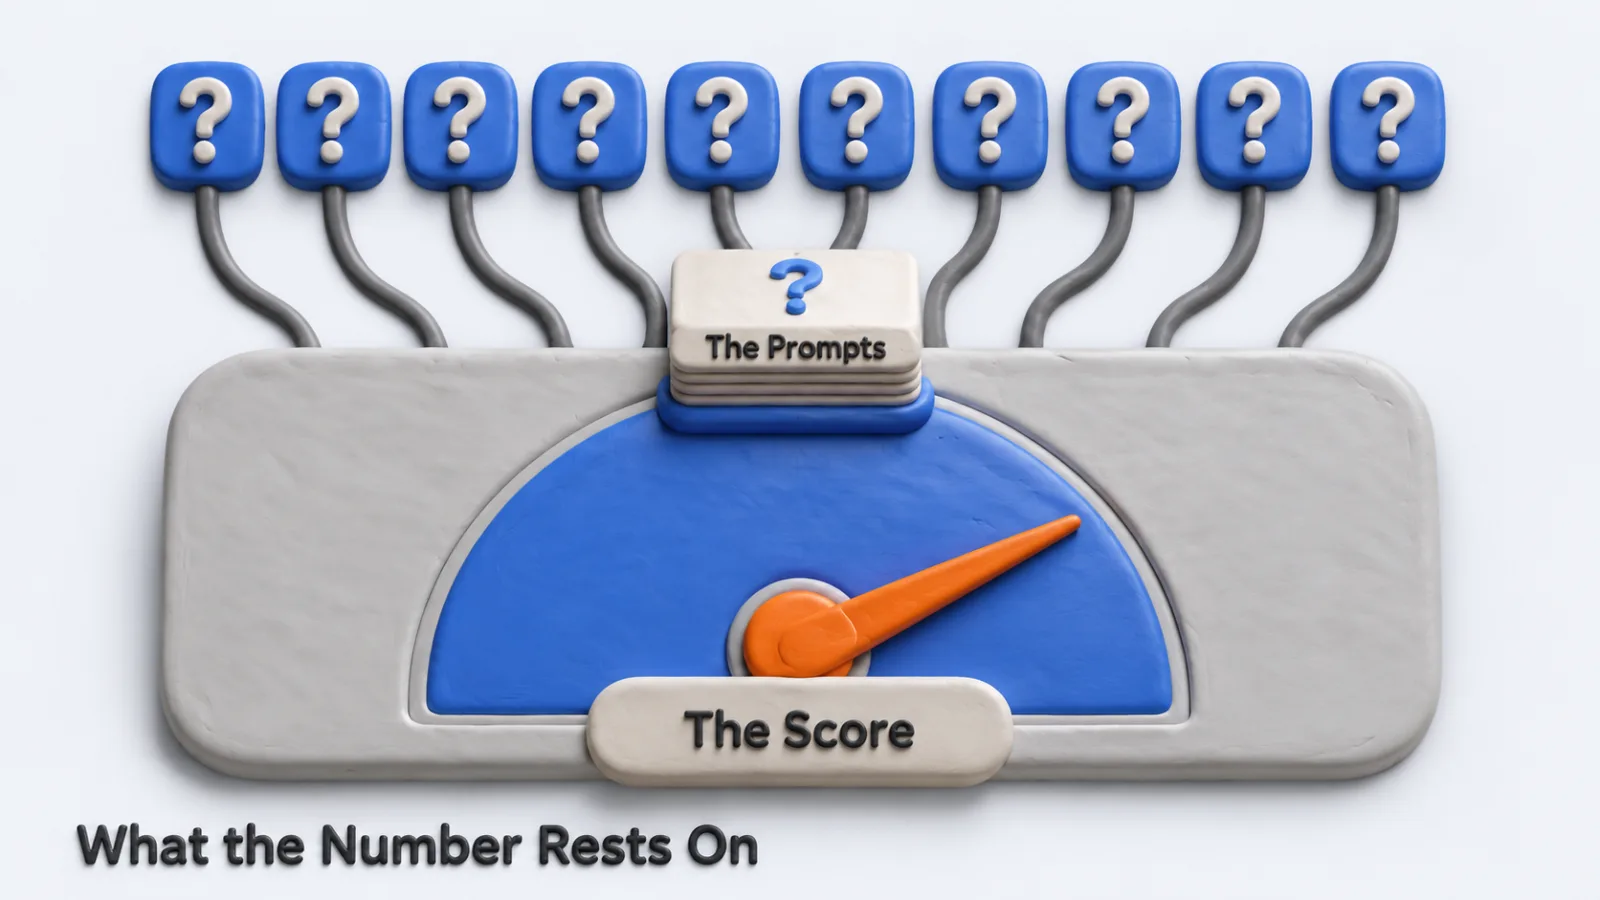
The tool holds a list of prompts and sends each one to the major assistants on a schedule.
It reads the answers back and records three things: whether your brand appeared, where in the answer it sat, and which source the assistant cited.
Those records roll up into the numbers on the dashboard: a visibility percentage, a share of voice against competitors, a sentiment reading. All of it describes the prompt list, not the market.
Why Two Tools Disagree About You
They disagree because they’re asking different questions.
One vendor’s list might hold 40 prompts built around category terms. Another builds 200 around buying questions, competitor comparisons and problem statements. A brand strong on comparison questions and absent from category questions scores well on the second list and badly on the first.
Neither number is wrong. They answer different questions, and the dashboards present both as though they measured the same thing.
How Assistants Choose What to Cite
Two separate mechanisms decide whether your name shows up, and they behave nothing alike.
The first is training data, meaning whatever the model absorbed when it was built. You can’t edit that, and a brand named from training data usually appears with no citation beside it.
The second is retrieval: the live search an assistant runs before it answers. That produces the cited links, and it responds to work you do this quarter.
The distinction turns a score into a to-do list. Named without a citation is history you can’t change. Competitors cited where you aren’t is a page problem, and page problems are fixable.
The Prompt Set Is the Product
Everything else is reporting on top of that list.
Ask any vendor for the actual prompts before you pay. If the list is generic category phrasing and your buyers arrive asking about a specific workflow, the tracking will be steady, precise and about somebody else’s market.
A tool that lets you write and edit your own prompts is worth more than one with a larger model roster. Coverage of engines is easy to add. A prompt set matched to your buyers is the part that makes the number mean anything.
Building Your First Prompt Set
Twenty prompts, written in three groups, covers most of what a small team needs.
Start with ten buying questions, phrased the way somebody asks them out loud rather than the way your category names itself. Add five problem statements from before the buyer knows a category exists, because that’s where assistants do the most steering.
Finish with five comparisons naming your closest rivals. Those are the prompts where an assistant has to choose, and choosing is where you find out what it thinks you’re for.
Keep the total under thirty to begin with. Every prompt is a line on the invoice, and a tight list you understand beats a long one you inherited.
Sampling Is Not Traffic
A visibility percentage looks like a traffic metric and behaves like a poll.
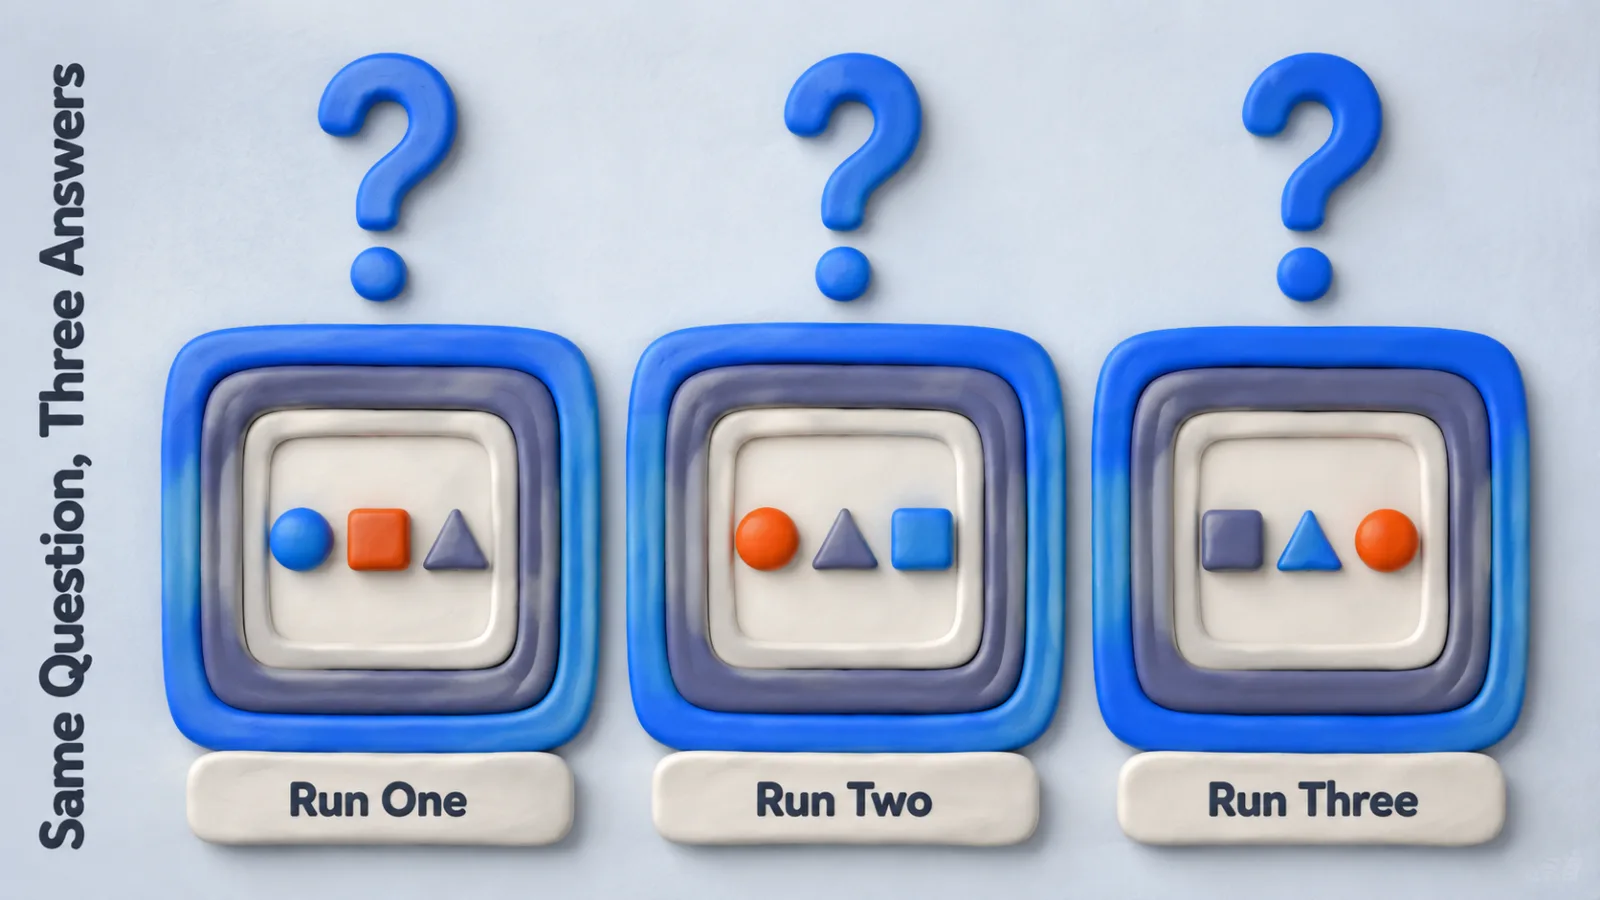
Assistants don’t answer deterministically. Run the same prompt three times and you can get three answers with different brands named, and a model update can move every result overnight.
So treat the weekly figure the way you’d treat a poll with a small sample. The direction over a quarter carries information, and a three-point move since last Tuesday usually doesn’t.
Three Ways the Score Misleads
Each one inflates or deflates the number without anybody noticing.
The first is an ordinary-word brand name. If your company shares a name with a common noun, the tool counts answers that had nothing to do with you.
The score reads high, and none of the height is yours.
The second is a competitor set nobody revisited. Share of voice is measured against the rivals configured on day one, so a strong number can mean you’re beating companies you no longer compete with.
The third is a market mismatch. A tool defaulting to one country and language will report a confident score for a market you don’t sell into.
The Baseline That Costs Nothing
Do this before you buy anything.
Write down the ten questions your buyers ask before they choose a vendor. Put each one to Perplexity, Gemini and the other assistants you care about.
Record whether you appear, which competitors appear, and which pages get cited.
That’s an afternoon of work and it produces the same thing a trial produces: a baseline. It also tells you whether the gap is worth a subscription, because a brand absent from all thirty answers has a content problem that no tracking dashboard fixes.
Three Shapes of Tool
The category is sold as one thing and splits into three.
| Shape | What it does | Suits |
|---|---|---|
| Monitors | Tracks prompts and reports appearances over time | Watching a position you already hold |
| Auditors | Checks whether your pages can be crawled and cited | Fixing why you’re absent |
| Suite add-ons | Folds assistant data into an existing SEO platform | Teams already paying for that suite |
The distinction matters because they solve opposite problems. A monitor tells you that you’re missing, and an auditor tells you why, and buying the first when you needed the second produces a year of well-charted absence.
What Moves the Number
Three things shift assistant answers, and none of them works in a week.
- Appearing on the pages assistants already cite: listings, comparisons and forums.
- Writing answers plainly enough on your own pages to be quoted without rewriting.
- Naming your product consistently, so a model connects it to your company and category.
The first is the one teams underrate. Assistants lean on third-party pages when they answer comparison questions, so being absent from the sources they trust costs more than anything on your own site.
Which Engines Are Worth Tracking
Paying per engine you don’t need is the easiest way to overspend here.
Check your analytics referrals before you choose. Assistant traffic arrives with its own referrer, so you can see which ones already send you people rather than guessing.
Two engines that cover your referrals are worth more than ten that cover none. Consumer brands and B2B tools rarely land on the same two, which is why a vendor’s default selection is a poor starting point.
How They Price It
Three things drive the invoice, and features aren’t among them.
- Prompts tracked, which is the main meter on almost every plan.
- Brands or domains covered, charged per brand on most tiers.
- Markets and languages, priced the way localization is priced everywhere.
Entry tiers land between 50 and 200 dollars a month, and enterprise plans reach four figures. Work out your prompt count first, because that number decides your tier more than any feature comparison will.
What a Trial Should Prove
Four things, and none of them is whether the dashboard looks good.
First, that you can edit the prompt list, and that your edits are what gets tracked. Second, that the tool shows the raw answer text and not only a score, because the text is where you learn why you were left out.
Third, that citations are attributed to specific URLs, which is what turns a score into work somebody can do. Fourth, that two runs a week apart on an unchanged site produce roughly the same number.
That last one is the test vendors like least. It measures the tool’s noise floor, and a tool that swings ten points on an unchanged site can’t detect a ten-point improvement.
Reading the Citation Report
The citation list is the only output that converts straight into work.
For each prompt, the tool records which URLs the assistant leaned on. Sort those by how often they appear across your whole prompt set, and you get a ranked list of the pages that decide your category’s answers.
Some will be your own. Most won’t, and the ones that aren’t are the real finding: they’re the pages where being absent costs you the answer.
Work that list top down. A directory or comparison page cited on twelve of your twenty prompts is worth more attention than a blog post cited on one.
Running It Yourself
Nothing about this is technically hard, and the cost difference is large enough to check.
Every major assistant exposes an API. A short script can send thirty prompts to three models once a week, store the replies, and search them for your brand name.
That’s an afternoon of work and a few dollars a month in tokens.
| Route | Monthly cost | What you give up |
|---|---|---|
| Your own script | Token cost, a few dollars | Dashboards, sentiment, alerting |
| Entry tier tool | 50 to 200 dollars | Control of the prompt list on some plans |
| Enterprise tool | Four figures | Little, at a price that needs justifying |
The script stops being the cheaper option once somebody has to maintain it, and once people who don’t write code need to read the output. Until then it answers the same question the entry tier answers.
A Cadence That Fits the Signal
Monthly, not weekly, and quarterly for anything you report upward.
The noise floor makes weekly review actively misleading. A team watching a dashboard every Monday will find patterns in sampling variance and change things in response to nothing.
Look at three things each month: the direction over the last quarter, any prompt where you dropped out entirely, and new URLs appearing in the citation list. The first is your trend, the second is a regression, and the third is where the category is moving.
Not the Same Job as Rank Tracking
The dashboards borrow the vocabulary of rank tracking and measure something with different rules.
A search ranking is a position in an ordered list. It’s the same for everyone asking that question, and it holds still long enough to be worth a number.
None of those three things is true of an assistant answer.
There’s no ordered list, the answer is assembled per question, and two people asking the same thing get different text. So a visibility percentage is closer to a survey result than to a rank, and it deserves the error bars a survey gets.
That changes what a good week looks like. In rank tracking, moving from nine to four is a fact. Here, moving from 22 percent to 27 percent might be a fact or might be the same month measured twice.
What Share of Voice Divides By
The most quoted number on these dashboards is also the least defined.
Share of voice needs a denominator, and vendors pick different ones. Some divide your mentions by total mentions of every brand named across the prompt set. Others divide by the number of prompts where any brand was named at all.
Those produce different percentages from identical data. A category where assistants name six brands per answer will look thin under the first method and healthy under the second.
Ask which one you’re being shown before you put it in a board deck. It’s the number most likely to be compared against a competitor’s tool and found to disagree.
Sentiment Is the Weakest Reading
Every vendor ships it and it carries the least information on the page.
Assistant answers about software are mostly descriptive. They list what a tool does, who it suits and what it costs, which classifies as neutral almost every time.
So the sentiment line sits flat whatever else changes.
Where it earns attention is the exception: a persistent negative note in answers about your category, usually traceable to one widely cited review or forum thread. That’s worth finding, and you’ll find it in the citation list rather than in the sentiment score.
Don’t pay a tier premium for sentiment. Pay for prompt control and citation reporting, and read sentiment as a flag rather than a metric.
The Threshold for Paying
One threshold decides it.
If assistants are already sending you traffic or your sales calls mention them, tracking buys you a feedback loop on work you’re doing anyway. If they aren’t, a subscription buys a weekly reminder of a problem you can already see for free.
The same logic applies to generative engine optimization as a practice. Measure what you’re changing, and don’t buy measurement for a thing you haven’t started changing yet.
Questions to Ask Before Subscribing
- Prompts: can we see the exact list, and can we edit it?
- Answers: is the raw response stored, or only the score?
- Citations: are cited URLs reported per prompt?
- Stability: how much does the score move on an unchanged site?
- Export: can we take the history with us when we leave?
The export question catches people out. A year of tracking history is the asset you’re building, and some plans keep it behind the subscription.
Brand Monitoring With a New Surface
Assistant tracking is brand monitoring with a different surface.
The questions are the ones media monitoring software has always answered: where are we mentioned, in what context, and against whom. What changed is that the mention now sits inside a generated answer rather than on a page you can link to.
Teams already running brand monitoring often find the assistant layer is an add-on to what they own rather than a new subscription. That’s worth checking before you buy twice.
Questions People Ask About AI Visibility Software
What does AI visibility software measure?
It measures how often your brand appears in answers to a set of prompts the tool runs itself. No vendor has access to the assistants’ real query logs, so the prompt set stands in for real demand.
Why do two tools give my brand different scores?
They give different scores because they ask different questions. Each vendor builds its own prompt set, and a brand that answers one set of questions well can be absent from another set entirely.
Can I check my AI visibility for free?
Yes. Open each assistant, ask the ten questions your buyers put to you, and record whether you appear. That baseline costs an afternoon and shows whether paid tracking is worth it.
How much does AI visibility software cost?
Entry tiers run from about 50 to 200 dollars a month, and enterprise plans reach four figures. Price scales with tracked prompts, brands and markets rather than with features.
Is a weekly change in the score meaningful?
Frequently not. The same prompt returns different answers run to run, so a few points of weekly movement is sampling noise rather than a result worth acting on.
Start With the Questions, Not the Tool
The tools in this AI visibility software category differ less than their marketing suggests. They all send prompts, read answers and count appearances.
What separates a useful subscription from an expensive one is whether the prompts match the questions your buyers put to you. Write that list first, and the tool choice gets easier and cheaper.
Add SocialAtoZ as a preferred source
See us more often in your Google results.